
Loading...
Shopify Growth Case Study
 Case Study
eCommerce Growth · Shopify
-
Client:
Confidential
-
Category:
eCommerce Growth · Shopify(Multi-Category)
-
Date:
Feb 2025 to Feb 2026
-
Location:
Pakistan
From Shopify Store to PKR 23.6M in Sales
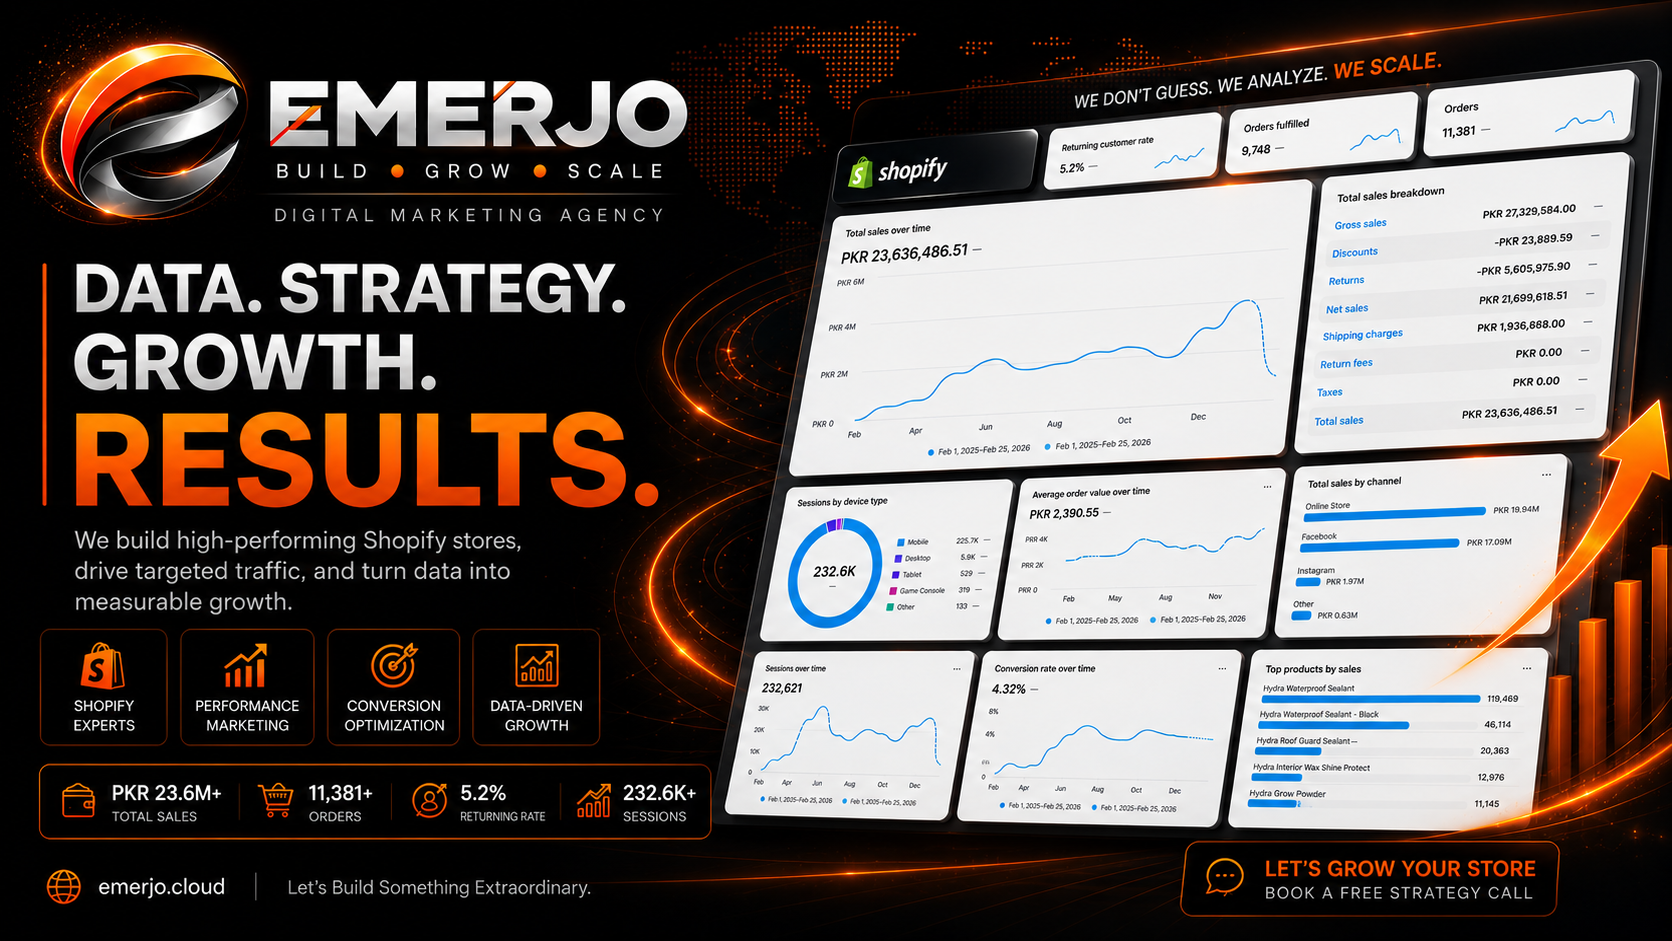
PKR 23.63MTotal Sales
4.32%Conversion Rate
~80%COD Delivery Success*
This engagement was completed under a signed Non-Disclosure Agreement, so the client's name and brand identity cannot be shared publicly. What follows is the scope of work and selected performance results from the reporting period, Feb 1, 2025 to Feb 25, 2026.
1
The Challenge
EMERJO partnered with a Pakistan-based multi-category eCommerce business to build, manage, market, and continuously optimize its Shopify operation. In a market where Cash on Delivery drives the majority of orders, a placed order is only the midpoint of the journey, not the outcome. The real challenge was building a system that could attract qualified customers, convert them into orders, and carry those orders through to a successful delivery, not simply generate more traffic.
2
The Approach
Rather than treating this as a single service, EMERJO managed the full commerce journey as one connected system: strategy, Shopify design and development, product and catalog management, performance marketing, conversion rate optimization, and ongoing store and order management, all working together instead of as separate services stitched together.
3
The Result
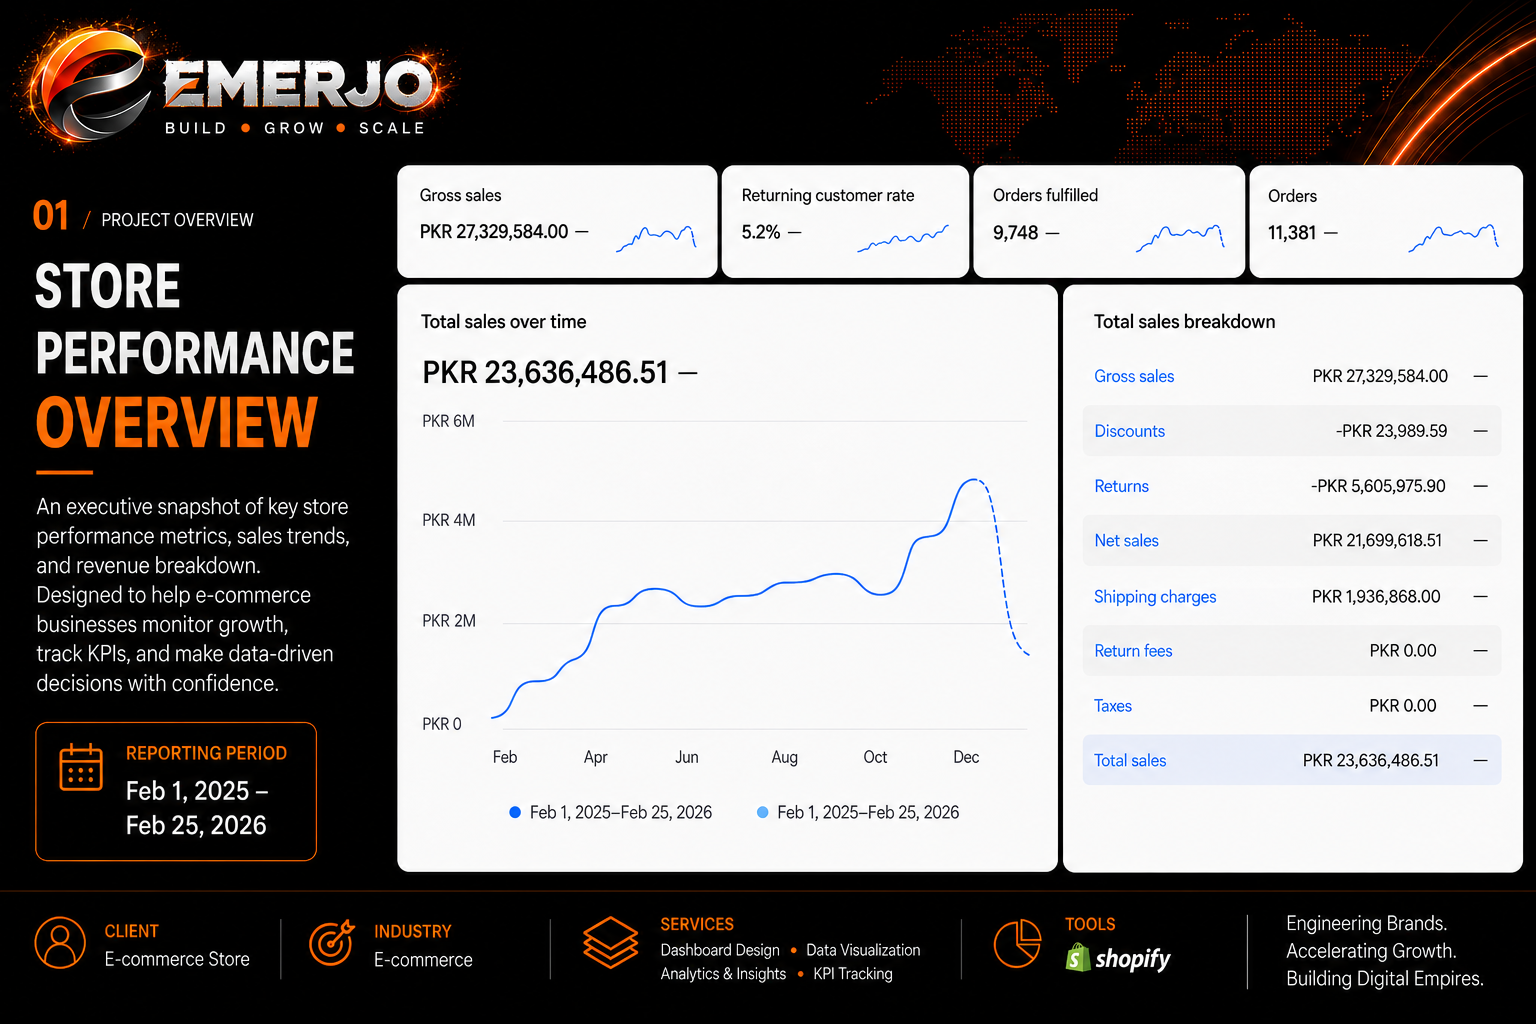
Over the 13-month reporting period, the store recorded PKR 23.63M in total sales (PKR 27.33M gross) from 11,381 orders (9,748 fulfilled), at a 4.32% conversion rate across 232,621 sessions. Because Cash on Delivery introduces a second conversion point after checkout, part of the engagement focused on order and fulfillment quality rather than order volume alone. The store achieved an approximately 80% successful COD delivery rate, based on the client's operational reporting.
Scope of Work
Rather than treating this as a single service, EMERJO managed the full commerce journey as five connected phases working as one system.
1
Strategy
Market and competitor research, product and category planning, customer journey mapping, and a sales funnel strategy built around the business's real objectives.
2
Shopify Design & Development
Store architecture, UI/UX, theme customization, product pages, and a checkout journey built for mobile usability and conversion.
3
Performance Marketing
Facebook and Instagram advertising, audience targeting, creative testing, retargeting, and budget optimization tied directly to product and landing-page performance.
4
Conversion Rate Optimization
Continuous testing across product pages, landing pages, offer presentation, and the cart and checkout experience.
5
COD Optimization & Store Management
Ongoing order management and fulfillment coordination focused on improving the share of orders that convert into successful deliveries, not just orders placed.
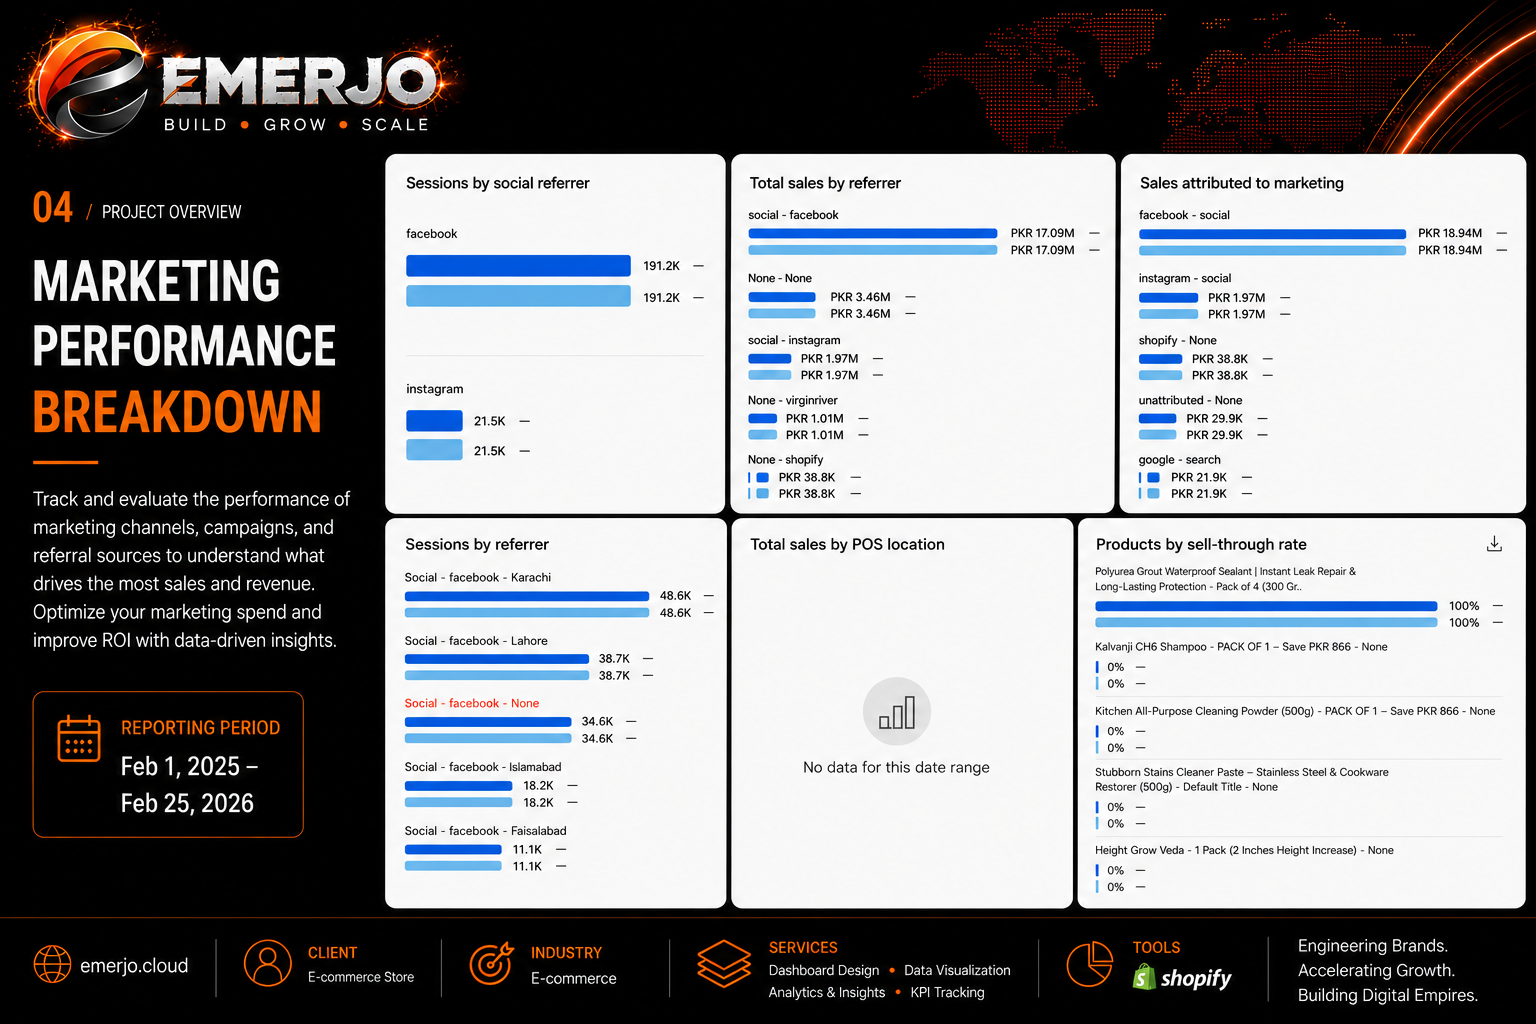
Store & Campaign Visuals
A look at the storefront and campaign work behind the results below.
Best-Selling Products
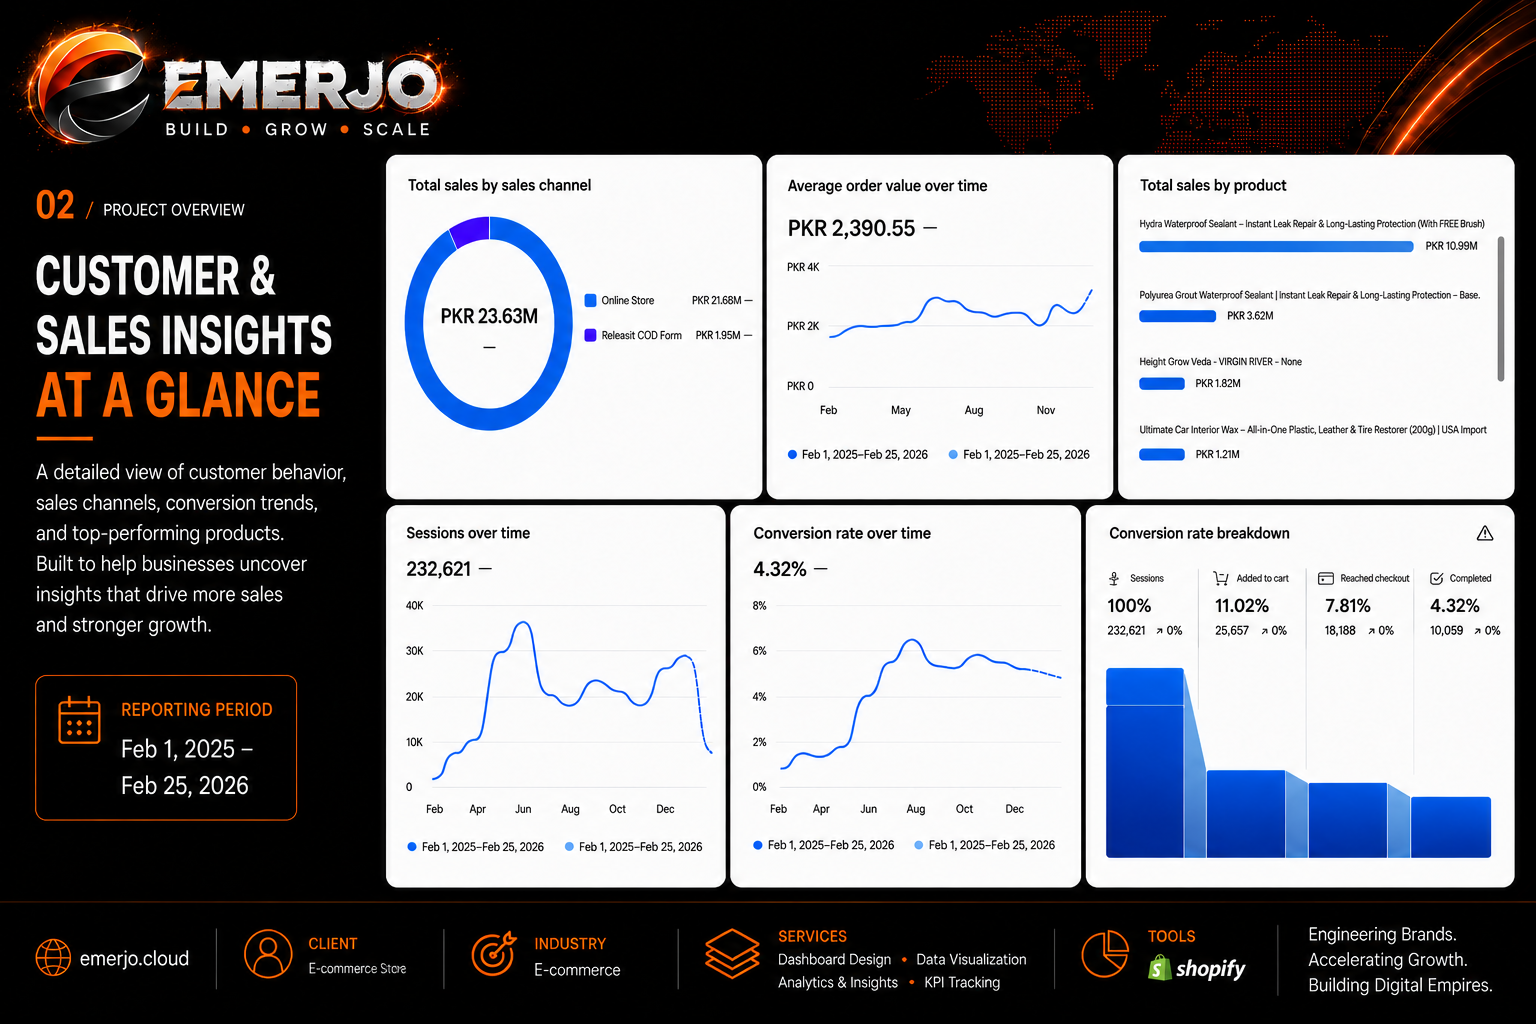
One product line carried a disproportionate share of revenue — useful context for where marketing budget concentrated.
The top 3 products account for roughly 60% of gross sales — bar length is scaled relative to the top seller.
01
Hydra Waterproof SealantFlagship product · top landing page (119K+ sessions)
PKR 10.99M02
Polyurea Grout Waterproof Sealant100% sell-through rate for the period
PKR 3.62M03
Height Grow VedaThird-highest revenue product
PKR 1.82MTop Landing Pages
Sessions by landing page over the reporting period — the flagship product page alone drew more than half of all recorded landing-page sessions.
01
Hydra Waterproof Sealant
119,469 sessions02
Hydra Waterproof Sealant (Black)
46,114 sessions03
Ultimate Car Interior Wax
20,363 sessions04
Roof Guard Hydra Sealant
12,976 sessions05
Height Grow Powder
11,145 sessions06
Instant Electric Faucet Water Heater
4,067 sessions07
Homepage
3,898 sessions08
Men's Tummy Control Compression Shirt
3,641 sessions09
USA Imported Wall Repair Paste
1,523 sessions10
Complete Skincare and Haircare Set
1,108 sessionsWhere the Traffic Came From
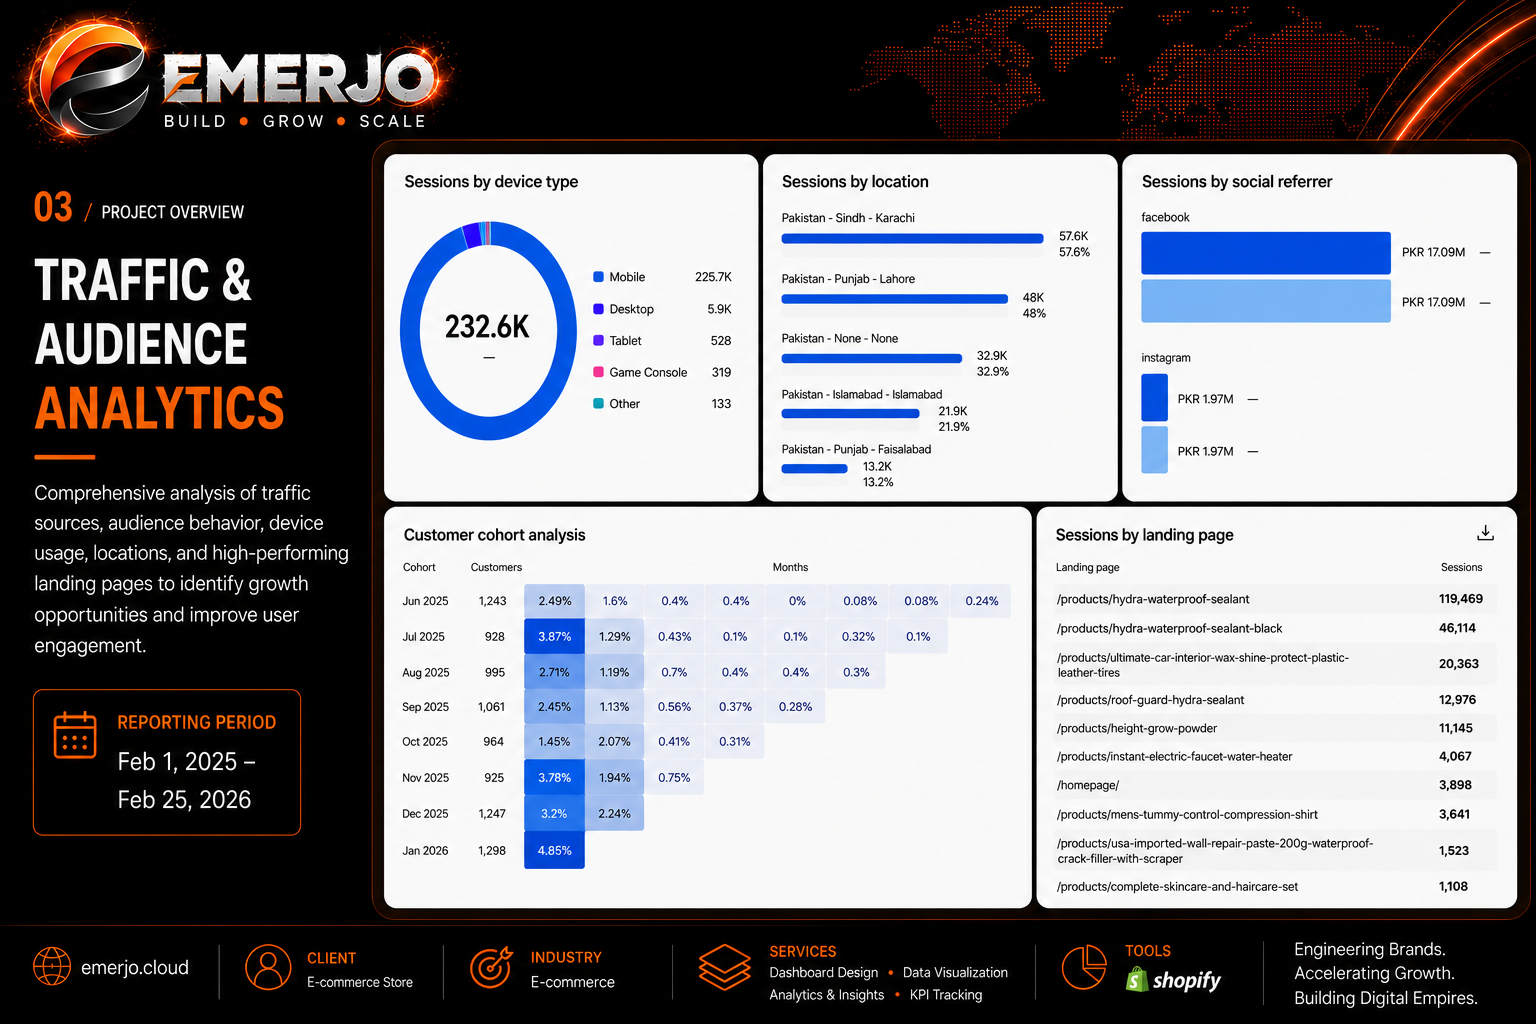
Paid social carried the majority of acquisition. Facebook alone drove 191,200+ sessions and PKR 17.09M in attributed sales; Instagram added a further PKR 1.97M in attributed sales across 21,500+ sessions. 97% of all sessions came from mobile devices, and traffic was heavily concentrated in Karachi, Lahore, and Islamabad.
Sessions by Social Channel
Facebook191.2K
Instagram21.5K
Attributed Sales by Channel
FacebookPKR 17.09M
InstagramPKR 1.97M
Where The Revenue Went
Gross sales down to what actually landed, after discounts, returns, and shipping.
Gross SalesPKR 27,329,584.00
Discounts−PKR 23,989.59
Returns−PKR 5,605,975.90
Net SalesPKR 21,699,618.51
Shipping ChargesPKR 1,936,868.00
Total SalesPKR 23,636,486.51
In a Cash on Delivery market, average delivery success typically runs 65–70%; this store achieved roughly 80%. The Returns figure above isn't limited to post-delivery returns — it also includes orders the customer canceled before dispatch, caught by a confirmation call placed on every COD order before it ships.
Growth Metrics & Impact
End-to-end eCommerce management, spanning the Shopify build, product and catalog management, performance marketing, conversion rate optimization, and COD delivery optimization, turned steady traffic into a measurable, repeatable revenue system over a 13-month engagement.
PKR 23.63MTotal Sales
PKR 27.33MGross Sales
11,381Orders Placed
232,621Sessions
4.32%Conversion Rate
PKR 2,390.55Average Order Value
5.2%Returning Customer Rate
~80%COD Delivery Success*
Customer Retention By Cohort
Each row is a monthly cohort of first-time customers, with the share of that cohort that came back and bought again the following month.
| Cohort Month | New Customers | Repeat Rate (Month 2) |
|---|---|---|
| Jun 2025 | 1,243 | 2.49% |
| Jul 2025 | 928 | 3.87% |
| Aug 2025 | 995 | 2.71% |
| Sep 2025 | 1,061 | 2.45% |
| Oct 2025 | 964 | 1.45% |
| Nov 2025 | 925 | 3.76% |
| Dec 2025 | 1,247 | 3.20% |
| Jan 2026 | 1,298 | 4.85% |
Month-2 repeat rates ranged from 1.45% to 4.85% across cohorts, consistent with the 5.2% overall returning customer rate reported above.
More Case Studies
See how the same connected approach played out across other channels.
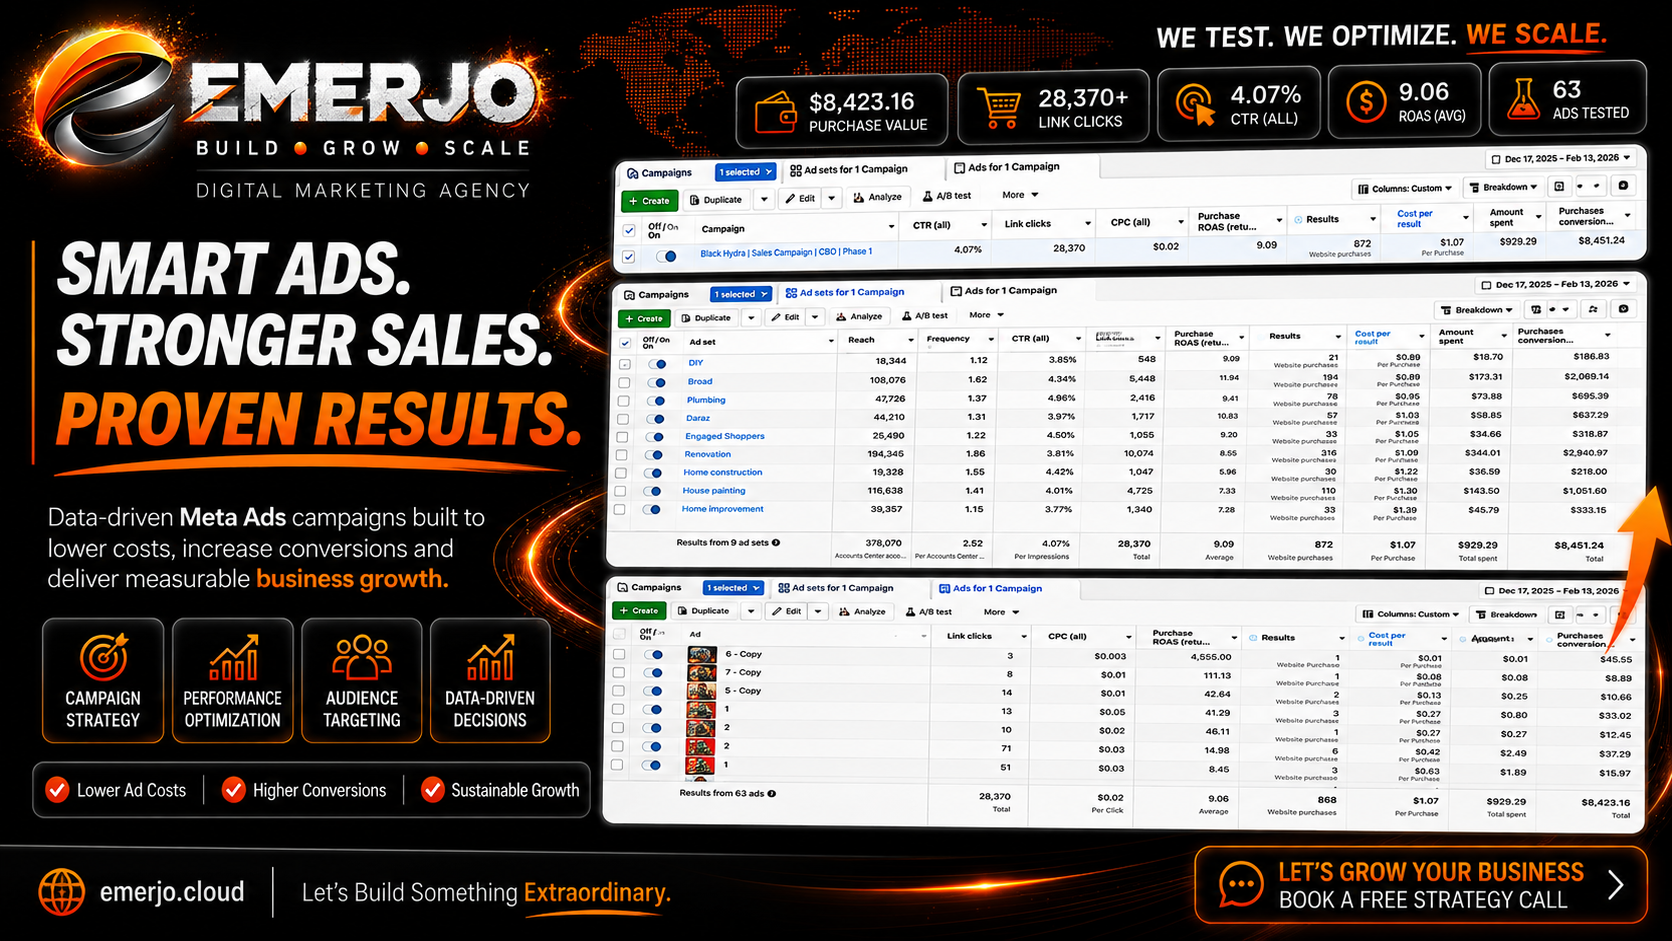
9.09x Return On Ad Spend In 58 Days
View Case Study
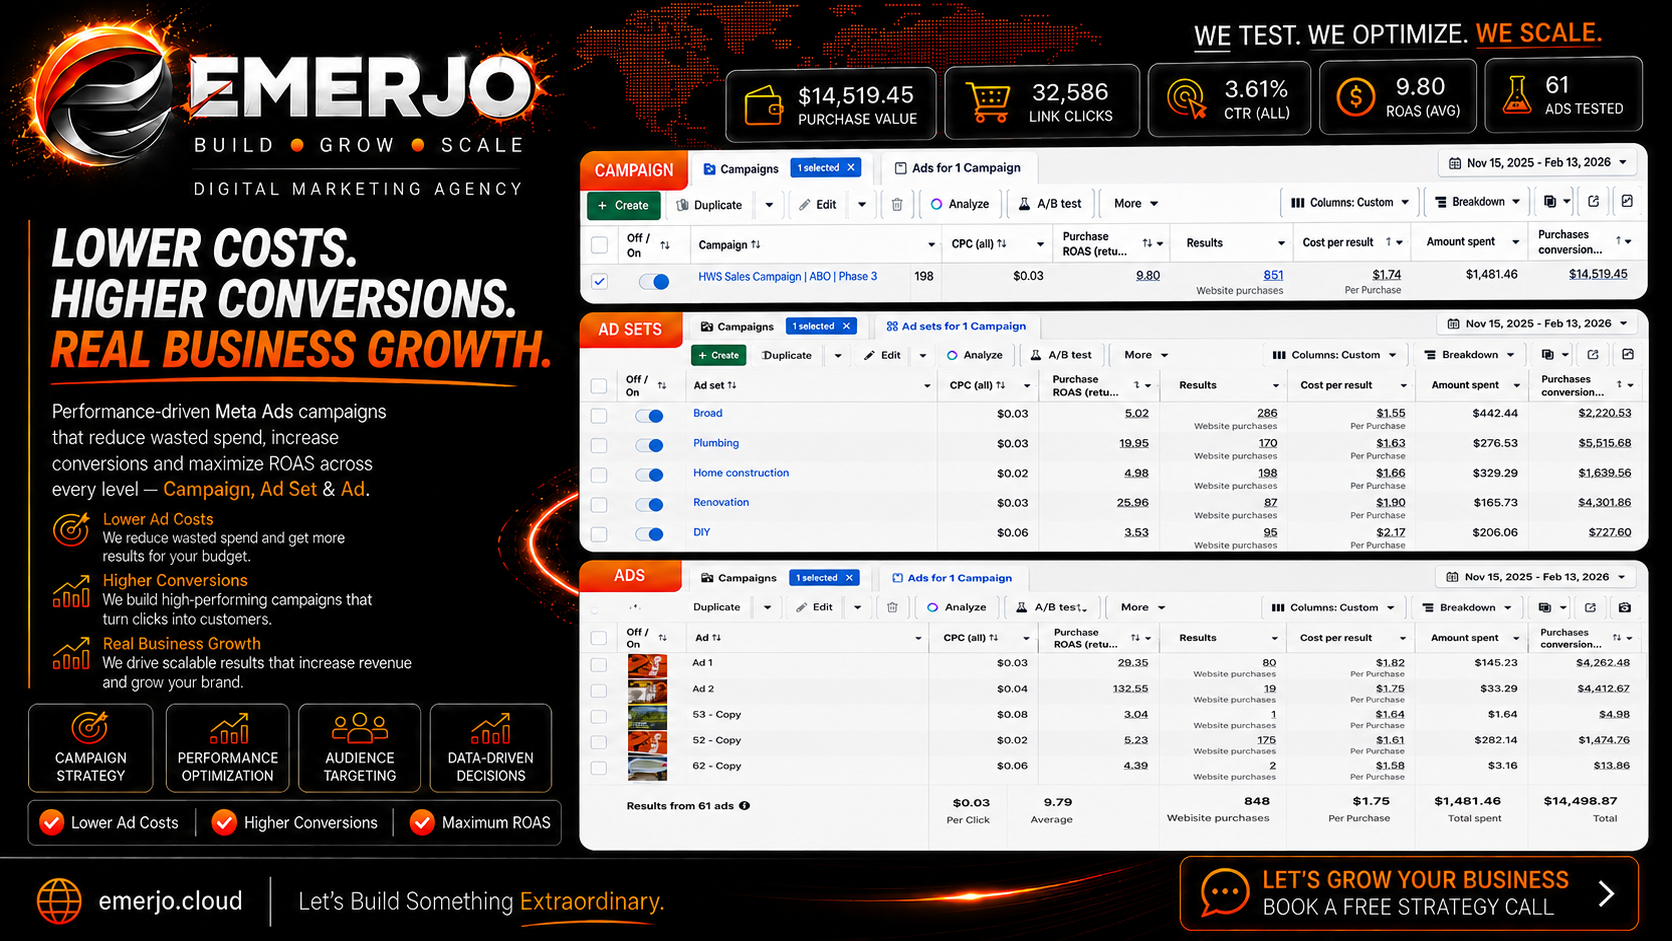
9.80x Average ROAS on Meta Ads for a Home Improvement Retailer
View Case Study
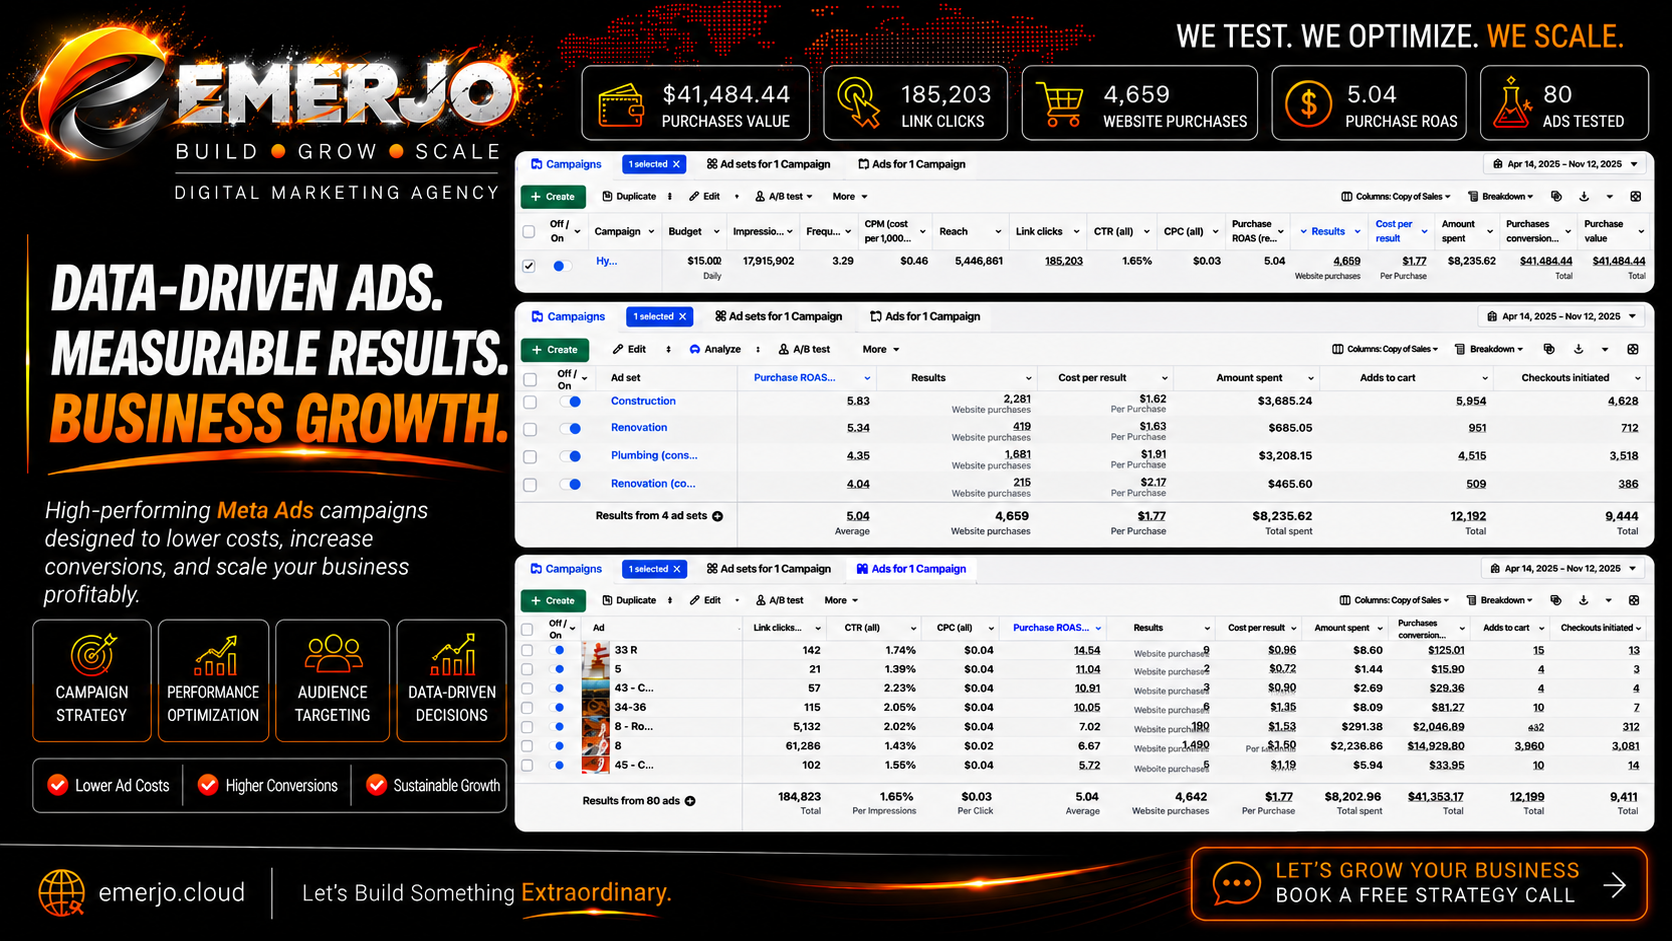
$41,484 In Purchase Value Over 7 Months
View Case Study
Frequently Asked Questions
A few common questions about this engagement and how the numbers above were sourced.
This project was completed under a signed Non-Disclosure Agreement, which is why the client's name and brand cannot be shared publicly. The numbers shown on this page are accurate and sourced directly from Shopify analytics and the client's own operational reporting for the Feb 2025 – Feb 2026 period.
Why is the ~80% COD delivery rate marked differently from the other stats?
Total sales, conversion rate, and the other figures above come directly from Shopify's own analytics. The ~80% COD delivery success rate is the one exception — it's based on the client's own operational reporting rather than a Shopify metric, since Shopify doesn't track post-dispatch delivery outcomes for Cash on Delivery orders.
Does this approach only work for COD-heavy markets like Pakistan?
The COD confirmation-call process and delivery optimization work were specific to this market, where Cash on Delivery is the dominant payment method. The underlying approach — conversion rate optimization, catalog management, and performance marketing — applies to any Shopify store, though the specific playbook would adjust for markets where prepaid checkout is more common.
Is EMERJO still managing this store?
Yes. This is an ongoing engagement rather than a one-off project — the scope of work above (performance marketing, catalog management, conversion rate optimization, and COD delivery optimization) reflects continuous, active management rather than a single campaign.
Does this only work for single-product stores, or multi-category catalogs too?
This store sells across multiple categories rather than one core product, which was part of the original challenge described above. The strategy was built around that spread rather than assuming one obvious audience, so it applies to multi-category catalogs as much as single-product stores.
What does "COD Optimization & Store Management" actually involve?
It includes a confirmation call placed on every Cash on Delivery order before it ships, which catches cancellations early, plus ongoing fulfillment coordination focused on the share of orders that actually convert into successful deliveries — not just orders placed. This is the operational work behind the ~80% COD delivery success rate above.
Want This For Your Shopify Store?
EMERJO manages Shopify strategy, marketing, and conversion optimization as one connected system. Let's talk about what that could look like for your store.
Book A Strategy Call